Kidzone: Create A Graph
Curator: Lisa Hawley
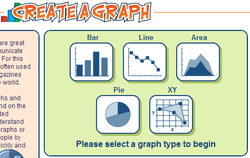
Create a Graph allows students to input data to create various kinds of graphs.
Grade Level: Any grade level
PSSM Content Standard: Data Analysis and Probability
CCSSM Content Standard: Measurement & Data
Math Content: graphs
What is being learned? What mathematics is the focus of the activity/technology? Is relational or instrumental understanding emphasized?
Students are learning to use graphs to represent and interpret data. Since the app does the graphing for the students, the focus is on the relational understanding of what the data represents.
How does learning take place? What are the underlying assumptions (explicit or implicit) about the nature of learning?
The learning with this app would come after the graph has been created and students discuss the meaning of the data.
What role does technology play? What advantages or disadvantages does the technology hold for this role? What unique contribution does the technology make in facilitating learning?
This technology allows students to represent their data using different types of graphs. The app simplifies the task of changing types of graphs. Students only need to click a few buttons, and do not have to re-enter their data. This could lead to an understanding of what types of graph are most appropriate for different kinds of data.
How does it fit within existing school curriculum? (e.g., is it intended to supplement or supplant existing curriculum? Is it intended to enhance the learning of something already central to the curriculum or some new set of understandings or competencies?)
Data analysis is a skill that is present at all grade levels. At the early elementary level, the focus is on simple bar graphs and picture graphs. Later in elementary school, students are introduced to scaled bar and picture graphs, line graphs and pie graphs. This app allows students to create lore bar, line and pie graphs. This app would be a supplement that could be used to focus on the meaning of the data rather than the process of creating the graph.
How does the technology fit or interact with the social context of learning? (e.g., Are computers used by individuals or groups? Does the technology/activity support collaboration or individual work? What sorts of interaction does the technology facilitate or hinder?)
This app seems to lend itself well to collaboration. Students could work as a team to enter and represent their data. Even if students use the app individually to create graphs of their data, interpreting the graphs could be done in groups.
How are important differences among learners taken into account?
The app could be used with students of all learning levels. Some students may need more support to use the app than others.
What do teachers and learners need to know? What demands are placed on teachers and other "users"? What knowledge is needed? What knowledge supports does the innovation provide (e.g., skills in using particular kinds of technology)?
Teachers should be familiar with the options available for students as they create their graphs. Students may need instruction in the vocabulary related to graph (title, scale, labels, x- and y-axis, etc) and how to use the app. Once they are familiar with the options, it should be fairly easy for most students to create graphs on this site. For very young students, the teacher may consider using this site to create graphs together with students.
